Immigrant Income Levels Depend on Canadian Immigration Program

Data from the Statistics Canada report on the income of immigrants, released in December, shows large differences in the economic performance of immigrants depending on which immigration program they were admitted through (Moxy)

In the second part of our series on the recently released Statistics Canada report on the income of immigrants, we delve deeper into the data and look at how various economic class immigration programs compare for immigrants who arrived between 1986 and 2010. The first part can be found here.

Among the most important immigration-related issues for the federal government every year is picking the right mix of immigration programs to make up the annual quota that it sets aside for new permanent residents.

The major priorities that the federal government seeks to meet in selecting the allocation are:

  • meeting the humanitarian commitments it has set for itself to re-settle a certain portion of the world’s refugees
  • accommodating Canadians whose family members live abroad and who they would like to re-unite with through family class immigration sponsorship
  • admitting immigrants that will contribute to Canada’s economy and meet its investment and labour needs

To meet the last objective, the federal government currently allocates 60 percent of the permanent residence quota to economic class immigration programs, which consist of the Federal Skilled Worker Class (FSWC), the Canadian Experience Class (CEC), the business class programs, and the provincial nominee class programs.

Historically, the skilled worker program (FSWC) has contributed the largest portion of Canada’s economic class immigrants, but there have been calls to increase the proportion admitted through programs in the business and provincial nominee classes.

The provincial governments in particular have frequently called on the federal government to allow them to pick a greater share of Canada’s immigrants through their respective provincial nominee programs (PNPs), which has resulted in their quotas being increased from 2,500 in 1999, to over 30,000 in 2009.

Whether the FSWC should remain the mainstay of Canadian economic-class immigration or whether the PNPs, or perhaps business class programs, should continue to see their role expanded, is a question that the StatCan report can help answer.

The 30 year longitudinal study (we have only reproduced 24 years of it, as we assessed the data from 1980-1986 to be too limited to be useful) has a few surprising findings.
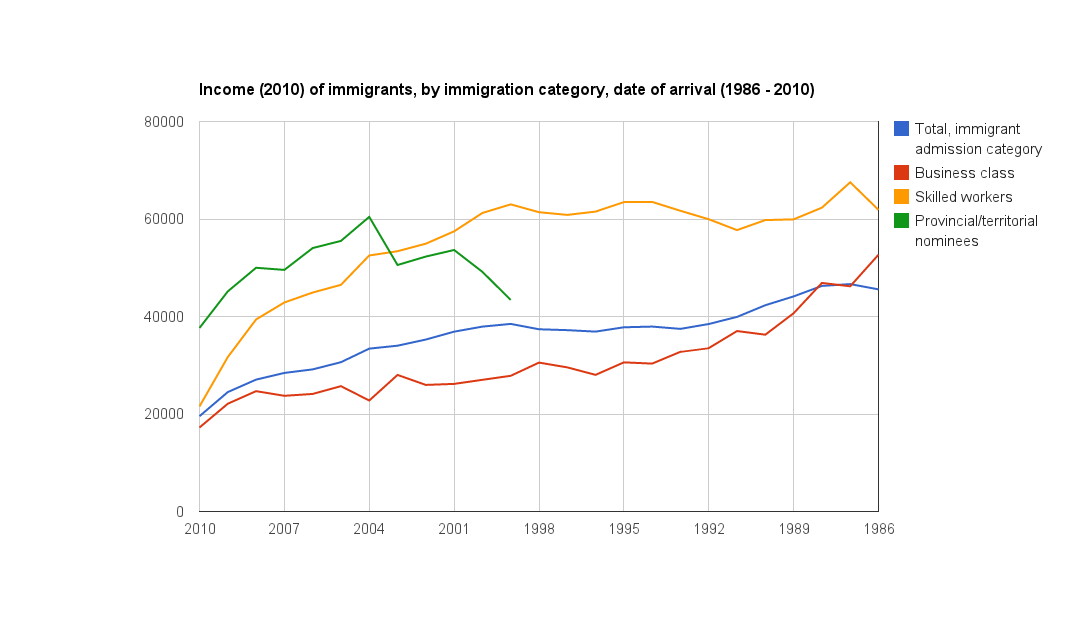
Income of immigrants by immigration program. Skilled worker class immigrants see the most wage growth over the 24 year period.

Early success for PNP immigrants, long-term success of the skilled worker class immigrants

Immigrants admitted through the FSWC earn significantly more than those admitted through the business classes, and after seven years in Canada, more than PNP class immigrants.
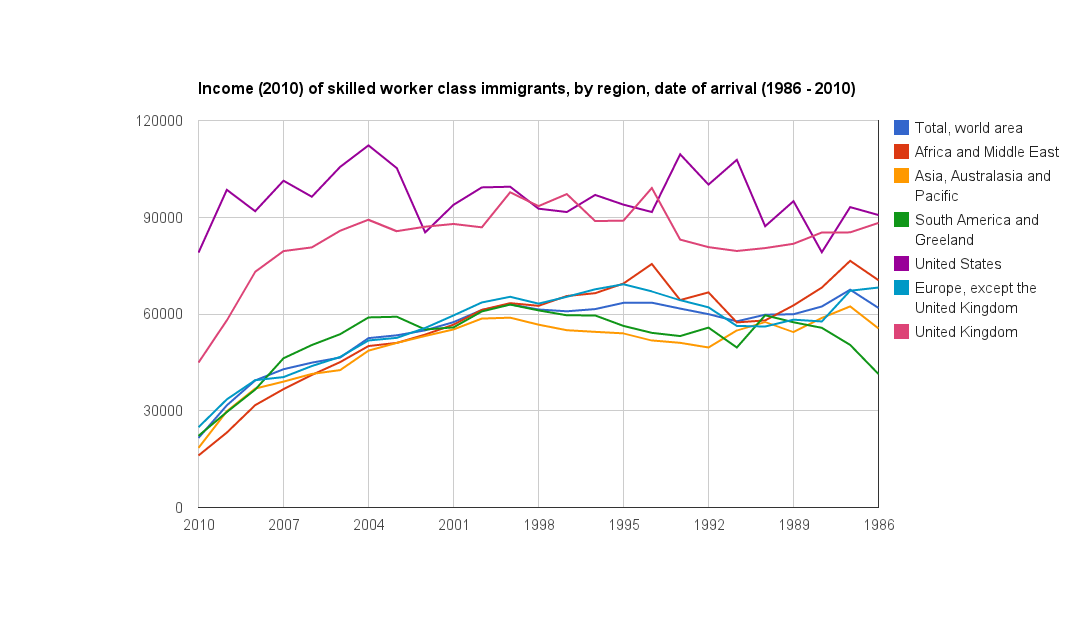
Average income in 2010 for skilled worker class immigrants. The graph shows rapid income gains in the first few years following immigration, followed by more gradual income growth

PNP-class immigrants earn nearly double what other immigrants earn in the first year of their permanent residence. This is most likely due to the fact that a person needs to already be in Canada and working to qualify for most provincial nominee programs, whereas immigrants who become permanent residents through the FSWC or business class programs arrive in Canada for the first time on the day they receive their permanent residency.

The data shows that the PNPs’ lead in income quickly closes, as FSWC immigrants see rapid income gains in their first few years in Canada.
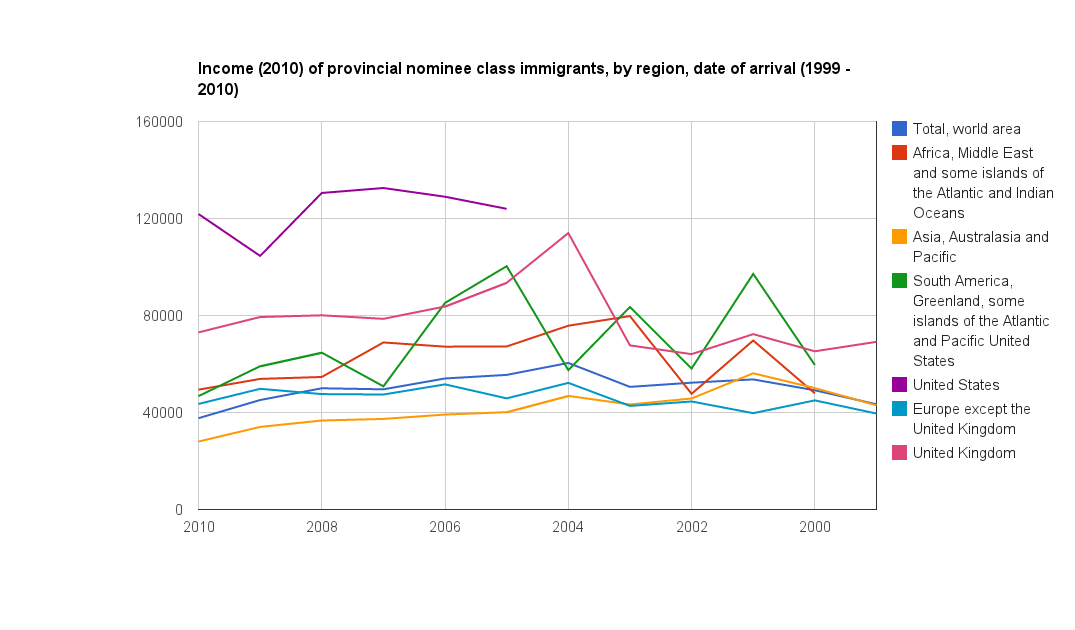
Average income in 2010 for provincial nominee (PNP) class immigrants. PNP-class immigrants start out with much higher incomes than other economic-class immigrants

It should be taken into account however that the data on PNP-class immigrants that arrived in the early 2000s is quite limited, given the provincial nominee programs admitted fewer than 10,000 immigrants for most of the first of half of the 2000s, so the long term income growth statistics for the PNP class could change over-time.

Poor performance of business class immigrants

The business class immigrants, despite having met demanding minimum net worth requirements to qualify for immigration to Canada, have lower income levels than skilled worker and provincial nominee class immigrants, especially in the first few years after they arrive.

Over the long run, their income gradually converges with the skilled worker class, but this takes nearly 24 years and it never meets the level of their skilled worker counterparts.

One partial exception to this is immigrants from the Africa and Middle East region. Business class immigrants in this group see their income surpass skilled worker class-immigrants from the same region after 24 years.
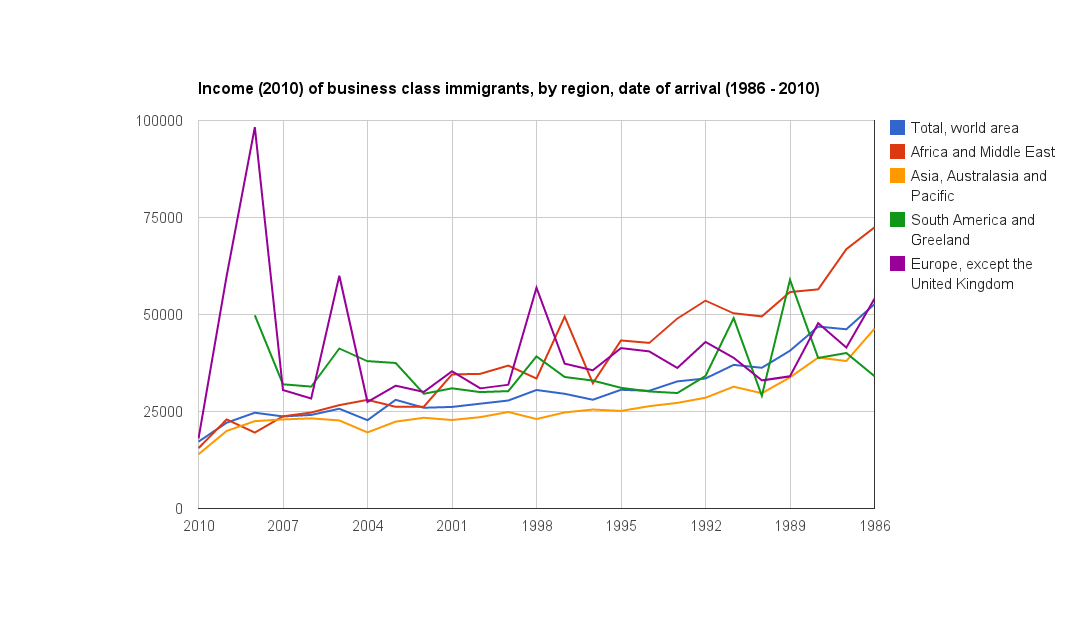
Average income in 2010 for business class immigrants. Business class immigrants from the Africa and Middle East region see significant income growth over a 24 year period

Cause of business class under-performance

Ideally, business class immigrants, with their substantial capital and business experience, would be the biggest contributors to the Canadian economy among the country’s immigrant population.

One possible explanation for their lower than expected incomes is that they keep their investments abroad.

Canada, which has relatively high average personal income tax rates, is out-matched in investment opportunities by many regions in the world, like the rapidly developing Asian country of South Korea, which has average personal income tax rates and government expenditure levels that are one third lower than Canada.

While business-class immigrants could choose to remain invested abroad, skilled worker class immigrants likely benefit from working in Canada, since it is a high-income country that provides better wages than the vast majority of the world, and in any case they have few options other than working and earning their salary in Canada, since labour is not mobile like capital.

If investment opportunities in Canada being comparatively poor is in fact the cause of lower than expected income performance of business class immigrants, this is not a problem that the federal government can fix by changing immigration selection rules.

New Canadian Immigration Program For Entrepreneurs To Launch April 1

Citizenship and Immigration Canada (CIC) would like to help Canada create an equivalent to Silicon Valley, pictured above, with a new Start-Up Visa for venture-backed entrepreneurs

Citizenship and Immigration Canada (CIC) announced today that the Start-Up Visa, which will grant permanent residence to entrepreneurs who receive funding from Canadian venture capital firms, will launch on April 1st.

“Our new Start-Up Visa will help make Canada the destination of choice for the world’s best and brightest to launch their companies. Recruiting dynamic entrepreneurs from around the world will help Canada remain competitive in the global economy,” said Citizenship and Immigration Minister Jason Kenney in promoting the new program.

The launch of the Start-Up Visa is part of a re-structuring of Canadian immigration rules to make them more flexible and focused on Canada’s economic needs.

Under the federal government’s new immigration framework, CIC can create immigration programs that are tailored to meet a particular economic need, and admit a limited number of permanent residents through them per year.

The Start-Up Visa, along with the Federal Skilled Trades Program which launched on January 4th, are the first of this new breed of the limited quota, tailor-made programs, and are designed to meet specific shortages in high-growth sectors in Canada’s economy.

Start-Up Designation

In order to qualify for a Start-Up Visa, an entrepreneur must receive funding from an angel investor group or venture capital fund.

CIC will delegate Canada’s Venture Capital & Private Equity Association (CVCA) and the National Angel Capital Organization (NACO) the authority to designate members of their associations to be eligible to participate in the program.

The Immigration Department is also working with the Canadian Association of Business Incubation in order to include business incubators in the list of eligible funding organizations.

Income of Canadian Immigrants Varies Depending on Time, Country of Origin

British immigrants to Canada, which include renowned news broadcaster Peter Mansbridge, have the highest average income among immigrant groups of different regions of origin (Geoff Campbell at Mount Allison University)

This is the first of our two part series on the recently released Statistics Canada report on the income of immigrants. We analyse income trends for immigrants from different regions of the world who arrived between 2006 and 2010. The second part of this series can be found here.

Data released last month by Statistics Canada shows large variance in the average income of immigrants across groups divided by country of origin and date of arrival in Canada.

The data looks at income-receiving immigrants from six geographical regions: 1) Africa and the Middle East, 2) Asia, Australasia and the Pacific 3) South America and Greenland, 4) the United States, 5) Europe except the United Kingdom, and 6) the United Kingdom.

It tracks the immigrants’ incomes from 1980 to 2010, to find trends in income growth over time. In this report, we look at the 2006 to 2010 period to analyze the income growth of recent immigrants.

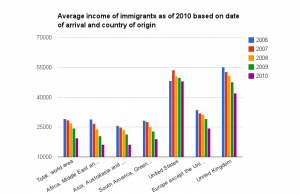
The results, seen below, show incomes rising as an immigrant’s time as a permanent resident in Canada increases.

For the newest cohort – those who arrived in 2010 – the average income was $19,548 in 2010. For those established in Canada the longest, since 2006, the average income as of 2010 was $29,151, a 50 percent advantage relative to the most recently arrived group.

Among different world areas, immigrants from the United Kingdom had by far the highest average income. Those who landed in 2006 had an average income of $55,081 by 2010. Immigrants from the United States followed, with those who had arrived in 2006 earning an average of $48,345 by 2010.

The remaining regions saw much lower average incomes, which were closer to the average income for the total immigrant population due to the fact that their members made up the majority of immigrants to Canada over the period.

Immigrants who had arrived in 2006 from the African and Middle East area, the Asia, Australasia and the Pacific area, and the South America and Greenland area, earned on average $28,944, $25,694, and $28,173 per year, respectively, by 2010.

In the middle of the pack were immigrants who had arrived in 2006 from the ‘Europe outside of the United Kingdom’ area, who earned $33,564 by 2010.

The data confirms previous findings that link proficiency in an official Canadian language and knowledge of Canadian culture with better economic performance for immigrants in Canada.

Canada’s immigration programs have been reformed in the past year to place greater emphasis on language ability, in order to select immigrants more likely to successfully integrate into Canada’s economy and labour market.

Regulatory Compliance Costs Canada’s Economy $6,000 per Employee, Possible Relief on the Way

Regulations cost Canadian businesses nearly $6,000 per employee per year, with most of that cost borne by small businesses

A report by the Canadian Federation of Independent Business (CFIB), which represents Canada’s small and medium sized businesses, estimates that the country’s regulatory burden costs Canadian businesses nearly $6,000 per employee per year, with the cost falling heaviest on small businesses.

The report, done in partnership with auditor KPMG, also found that compliance costs are higher in Canada than the US for businesses in all size categories except the largest – those with 100 or more employees – for which per employee costs in Canada, at $1,146, are slightly lower than the $1,278 cost in the U.S.

For the smallest businesses, which are categorized as those with 5 or fewer employees, regulatory costs in Canada average $5,942 per employee, significantly more than the $4,082 per employee cost in the US.

In the survey outlined in the report, 31 percent of Canadian business owners said they may not have gone into business if they had known the burden of regulation, a discouraging finding for Canada’s business environment.

The report is the second major analysis in the last year showing that regulations are placing a heavy burden on Canada’s smallest economic players.

A study by the Canadian Labour Market and Skills Researcher Network (CLSRN) last October found that occupational regulations are preventing many of Canada’s immigrants from working in their field of study, at a cost of $2-5.9 billion a year to the country’s economy.

A turning of the tide

Like most OECD countries, Canada has experienced gradual regulatory creep over the past several decades, as a diverse array of labour and business interest groups have promoted the expansion of regulations in their respective sectors, to limit the competition they face from the greater labour and business markets.

The trend could see a reversal over the coming years though, with the seminal Red Tape Reduction Action Plan. The plan is one of the most ambitious regulatory reform initiatives in Canadian history, and includes:

  • A One-for-One Rule which will require compliance costs imposed by the enactment of new regulations to be offset by an equal reduction of regulatory compliance costs through the reduction of existing regulations.
  • A Small Business Lens which will require regulators to take into account the costs imposed on small businesses by regulations.
  • The publication of Forward Plans, which will inform businesses of upcoming regulatory changes 24-months in advance of their enactment, to allow them to prepare for the changes.
  • Service Standards that set targets for speedy issuance of licences, certifications and permits, and encourage the establishment of feedback mechanisms by regulators for businesses subject to licensure.
  • An Annual Scorecard which will publicize progress on reforms, in particular the One-for-One Rule, the Small Business Lens and the Service Standards.

In addition to the six systemic reforms, the plan requires 90 department-specific reforms over the next three years. The President of the Treasury Board of Canada, Tony Clement, described the Red Tape Reduction Action Plan as a “game changer” when it was unveiled last October.

Canadian Government to Provide $400 Million to Bolster Domestic Venture Capital Industry

The headquarters of Shopify, one of Canada’s rising tech stars, in the ByWard Market district of Ottawa. The federal government hopes to see more high-growth technology companies like Shopify being started in Canada (GOOGLE MAPS)

The Harper government announced on Monday that it will inject $400 million in Canada’s venture capital industry as part of the Venture Capital Action Plan.

The goal of the plan is to encourage the creation of large venture capital funds that specialize in investing in early-stage, high-growth startup companies in Canada.

“Our Government understands that Canada’s long-term economic competitiveness in the emerging knowledge economy needs to be driven by globally competitive, high-growth businesses that innovate and create high-quality jobs,” said Prime Minister Stephen Harper in announcing the initiative.

$250 million of the $400 million of federal funding will be used to create a “fund of funds” for Canada’s venture capital industry, which will invest in Canada-focused venture capital funds.

$100 million will be invested into a private-sector counter-part to the government-run ‘fund of funds’, which will have a similar role as the government-administered fund, but with private and provincial co-funders.

The remaining $50 million will be invested into “three to five” existing high-performance Canadian venture capital funds.

The federal government has made several efforts over the past year to support Canada’s venture capital and startup industry, including providing publicity for the volunteer-led and funded Startup Canada project, and beginning consultations on creating a new ‘startup visa’ to provide a route for entrepreneurs with venture capital funding to immigrate to Canada.

With top marginal personal income tax rates that are among the highest in the world though, the government could face an uphill battle in fostering an entrepreneurial culture in Canada according to some analysts.

A study released by Canadian economist Ergete Ferede last year shows a negative correlation between the extent of redistribution and progressivity in the personal income tax and the rate of self-employment.

Report Projects Oil Sands to Contribute Trillions to the Canadian Economy

The Deloitte report says pipelines are the most efficient way to transport oil produced in Western Canada

A comprehensive report on the challenges and opportunities of Canada’s oil sands by auditing giant Deloitte projects that the hydrocarbon deposits will contribute an estimated $2.1 trillion to Canada’s GDP over the next 25 years.

The economic benefits of the added wealth include up to $783 billion in extra tax revenues over the period, which will provide a significant boost to local, provincial and federal governments and help them meet the growing costs of providing social services to an ageing population.

In addition to tax revenue, the export revenue generated from oil sands production will fund up to 905,000 jobs a year according to the Deloitte report.

The report cites lack of pipeline infrastructure as a potential limiting factor in the growth of Canada’s energy exports, as oil production is expected to reach current pipeline capacity by 2017.

Oil producers are currently look to use alternative transportation methods, in particular rail transport, to move the oil to international markets once pipeline capacity has been reached, but these solutions are expensive and inefficient in the long run, and the report says more efficient pipeline transportation will be required to fully realize the oil sands’ potential.

The report mentions the Northern Gateway pipeline, the Keystone XL pipeline and the Trans Mountain Expansion (TMX) as three pending infrastructure projects that are critical for providing sufficient conduits for getting Canada’s oil sands production to world markets.

According to Deloitte, the benefits of completing these projects include: 1) reducing up to $131 billions in losses that are currently incurred from Canadian oil being sold at below market prices due to lack of access to world markets, 2) reducing over-reliance on the US market, and 3) getting access to the fastest growing oil consuming regions of the world in India and China.

The biggest challenge in the oil sands development according to the report is the poor public perception of the oil industry in Canada and the hyperbolic nature of the debate surrounding the potential environmental harm of oil pipelines. The report urges a more fact-based debate on the costs and benefits of pipeline construction that avoids broad generalizations and sweeping judgements about environmental criticism, the oil industry, and energy projects.

Toronto Tops CIBC’s Annual Metropolitan Economic Index for Canadian Cities

Toronto has ranked near the top of the Canadian Metropolitan Economic Activity Index for five of the last seven years (Paul Bica)

Toronto leads all Canadian cities with a score of 20.6 points in the most recent CWM Metropolitan Economic Activity Index, which rates the economic activity of Canadian cities according to nine economic variables selected by CIBC’s World Markets subsidiary.

The indicators used in formulating the Index score include a city’s unemployment rate, population growth, bankruptcy rate and housing starts growth rate.

While Toronto did not lead other major Canadian cities in any of the nine areas of economic activity, it consistently ranked near the top in most of the categories, providing it with the highest cumulative score.

Toronto’s manufacturing sector benefited from an increase in automobile purchases in the United States as that country experienced an economic recovery, and an expansion of its construction industry, as housing starts, led by condominium construction, unexpectedly grew in the city.

Trailing Toronto in the top six Canadian cities were the Prairie metropolises of Calgary, Regina, Winnipeg, Saskatoon, and Edmonton in descending rank.

Calgary, coming second with a score of 19.5 points, continued to benefit from having one of the lowest unemployment rates, highest home sales growth rates, and highest population growth rates of Canadian metropolises.

Canada’s Population Hits 35 Million, Immigration Largest Source of Growth

Canada’s projected population surpassed 35 million last week as the country catches up to other G8 member states in population size (Martin C. Barry)

According to Statistics Canada’s population clock, Canada’s population passed 35 million last week, a notable landmark in the country’s developmental history, from a sparsely populated British colony in the 19th century to an emerging economic force in the world today.

The data shows that the annual population growth rate in the country has averaged 1 percent over the last decade, the highest among the G8.

The leading source of population growth continues to be immigration, with net migration (immigration minus emigration) accounting for two-thirds of population increases and natural population growth the rest.

StatCan projects Canada’s population will grow to between 40.1 and 47.7 million people by 2036, with the provinces of British Columbia and Ontario experiencing the largest increase in numbers.

Newfoundland and Labrador is projected to have the lowest population growth, even possibly negative, over the same period, as immigrants choose to settle in other provinces and its own residents migrate to other regions of the country, resulting in it having the oldest population, in terms of the median age of its residents, of any province.

Federal Government Backed Volunteer-Led Effort Promotes Canadian Start-Ups

The Startup Canada National Tour at its finale in Vancouver. The tour took Startup Canada to 40 Canadian cities where it consulted with over 20,000 people over six months (Cyprian Szalankiewicz)

Startup Canada, an entrepreneur-led government-backed non-profit organization, announced its action plan for increasing entrepreneurship in the country on Tuesday. The organization unveiled blueprints of a national network to support and connect entrepreneurial communities and a media campaign to create a strong entrepreneurial culture in Canada.

The action plan is the product of the Start-Up Canada National Tour which took the organization across the country from May to September 2012 and solicited input from over 20,000 entrepreneurs in 40 cities on how to create a national entrepreneur brand and foster Canada’s start-ups.

The action plan calls for three initiatives:

  • Startup Canada Connect: a social network to connect entrepreneurs
  • Startup Canada Communities: the creation of local entrepreneur communities, beginning with a pilot in 10 cities, which will organize local events, provide contacts to mentors, and support entrepreneurs as they develop their businesses
  • Startup Canada Campaign: a national media campaign to tell the stories of entrepreneurs in order to raise awareness of the role they play in Canada’s economy and promote them as role models in the country

Startup Canada is looking to launch the initiatives, including the Startup Canada Connect online social network, by May 2013, and is seeking to finance them through corporate sponsorships and crowd-funding.

Its current sponsors, which supported the Startup Canada National Tour, include Gowlings, Microsoft, Ernst & Young, Artik Promotions, PubliAir, and KA Media.

The organization launched its crowd-funding campaign on Tuesday through the Indiegogo platform: http://www.indiegogo.com/startupcanada and is looking to raise $100,000 in 34 days.

The action plan has been promoted by several federal officials, including Minister of State Small Business and Tourism Maxime Bernier, who spoke at an organization event in Montreal, and Industry Minister Tony Clement who was a speaker at an event in Ottawa, in Tuesday’s kick-off for the Startup Canada blue-print.

Canadian Farmers Income Increased by 53% in 2011

Canada's prairie provinces produce the majority of agricultural products in Canada. The province of Saskatchewan is sometimes known as the 'breadbasket' of the country for producing nearly 60 percent of grain grown in the country

Canadian farm income increased by 53 percent in 2011 from 2010 according to Statistics Canada. Realized net income, meaning farm income after operating expenses and depreciation, amounted to $5.7 billion last year, with farmers making gains despite a large increase in costs.

The 2011 gains follow a 19 percent increase in income in 2010 and a 19.6 percent decline in 2009 following the global financial crisis.

Agriculture and agrifoods is an important sector of the Canadian economy, accounting for 8 percent of its GDP, over $40 billion in export revenue, and nearly one in eight jobs in the country.

Canada is one of the largest agricultural producers in the world. Its prairie provinces: Alberta, Saskatchewan and Manitoba, produce a bulk of the agricultural products in the country. Nearly 60 percent of Canadian grain is grown in Saskatchewan, while nearly 50 percent of Canadian beef is produced in Alberta.

The prairie provinces have outperformed the rest of Canada in economic growth over the last several year and have among the best labour markets in North America.