StatsCan Report Links Income to Life Expectancy

A new StatsCan report finds a clear relationship between income and health in Canada, with Canadians in the highest income quintile having the lowest risk of dying from multiple causes

A new report on the state of health in Canada by Statistics Canada finds a strong link between between life expectancy and income in the country.

The report uses data collected from 1991 to 2006 in a Canadian census study on mortality, and measures the age-standardized mortality rates (ASMRs) of Canadians in five income groups.

It found that individuals in the highest income quintile had the lowest risk of dying, and the risk increased progressively with each move down an income quintile.

The major causes of death that saw big differences between individuals with different levels of income were ischemic heart disease, cancers of the trachea, bronchus and lung, and chronic obstructive pulmonary disease.

This suggests that a greater tendency among those in the lower income quintiles to engage high-risk behavior, in particular smoking, is a major cause of the differences in health outcomes.

A large difference was also seen in rate of death due to communicable diseases, with individuals in the lowest income quintile being 3.5 times more likely to die from HIV/AIDS than those in the highest.

Healthy immigrant effect

The link between income and health outcomes could explain the ‘healthy immigrant effect’, which is an observed phenomenon in which immigrants tend to arrive in Canada in a state of health that is better than members of the general population, but see a deterioration in their health in the years following their arrival.

As the income gap between recent immigrants and the general Canadian population has steadily increased since 1980, one result could be that the income-related health effects of immigration on new Canadians could have grown.

Income and population centres

The relevance of income to health is also worth considering when deciding where one should live in Canada.

Canadian census reports show that there is a sizeable personal income gap between rural and urban Canada, with urban areas having per capita incomes that are more than one fifth higher than rural districts.

The income gap between rural and urban Canada is paralleled by a life expectancy gap, with city-dwellers and those living within commuting distance of cities living longer than their rural counterparts.

Among Canadian cities, those with the highest median household income are Ottawa, the country’s capital, where it is $94,700, the Albertan metropolises of Calgary ($89,490) and Edmonton ($87,930), the capital city of Saskatchewan, Regina ($84,890), and Oshawa, Ontario ($82,270).

New Statistics Canada Report Shows High Education Levels Among Immigrants

Canadian immigrants hold slightly over half of all STEM university degrees in the country according to a new Statistics Canada report (Chris Moncus, CC-BY-SA-2.0)

A new Statistics Canada report on the educational attainment of Canadians shows once again that the country’s immigrants tend to be highly educated and educated in demanding fields of study.

The report’s most striking finding is that immigrants hold about half (50.9 percent) of the STEM (science, technology, engineering, and mathematics) university degrees in Canada.

With adult immigrants making up about 25 percent of the adult population of Canada, this indicates that immigrants are about twice as likely to hold STEM degrees as members of the general population.

These findings are likely a result of Canadian immigration selection criteria, that over the last few decades, has favoured applicants with occupational skills and experience that are in demand in Canada, which, like doctors and engineers, tend to require a STEM education.

Consistent with this explanation and demonstrating the high standards applicants for Canadian immigration are held to, the report found that over two-fifths of doctorate degrees held by Canadians were earned outside of Canada.

Despite these impressive figures, new Canadian immigrants earn substantially less than the average Canadian, with the gap growing since 1980 despite immigrants gaining on the general population in average level of educational attainment.

One possible cause of this discrepancy is a shift, that started in the 1970s, in immigration source countries, away from English-speaking countries at similar levels of economic development as Canada, to less developed, non-English-speaking countries.

The educational credentials from less developed countries are often not as valuable as an equivalent degree in Canada, while immigrants from these countries often require an adjustment period to adapt to Canada’s culture and become proficient in its official languages.

Immigrants from developed, English-speaking countries on the other hand often have an easier time adopting Canadian culture and integrating economically in the country.

TD Report: Asia No. 1 Source of Immigrants to Canada, But Share Shrinking

Traditional entrance gate to Montreal’s Chinatown. 63.4 percent of immigrants live in Canada’s three largest metropolitan areas: Montreal, Toronto and Vancouver according to the 2011 National Household Survey (Quinn Dombrowski)

A new TD analysis of the recently released 2011 National Household Survey (NHS) shows Asia is the largest, though shrinking, source of immigrants to Canada.

While 60 percent of immigrants originated in Asia, which includes the Middle East, in 2005, by 2011 that number had declined to 56.9 percent.

The three largest source countries for immigrants were all Asian: the Philippines, China and India. The Philippines saw its immigrant number nearly double from 2005 to 2011, while the share of immigrants from India and China declined, from a combined 27 percent in 2005, to 21 percent in 2011.

Among the major regions, the two that saw the biggest growth since 2005 were the Africa region, and the Caribbean and Central/South America region, which are now the origin of about 25 percent of Canadian immigrants.

The TD analysis also looked at where immigrants are settling. They continue to settle primarily (91 percent) in Canada’s largest 33 metropolitan areas, with the Big Three, Montreal, Toronto and Vancouver, continuing to lead the way.

The prairie metropolises of Alberta, Saskatchewan and Manitoba saw a small increase in their immigrant populations relative to the Big Three, likely as a result of the strong demand for labour seen in these provinces.

A final demographic measure looked at by the TD report was the change in the visible minority component of the Canadian population. The percentage of Canadians classified as visible minorities increased from 16.2 percent in 2005 to 19.1 percent in 2011, according to the NHS.

The three largest visible minority groups are South Asians (which include Indians, Pakistanis and Sri Lankans), at 1.6 million, Chinese, at 1.3 million, and blacks, at 945,000.

70 percent of visible minoritt immigrants live in one of the three largest metropolises; Montreal, Toronto or Vancouver.

More New Immigrants Moving to Smaller Cities- Calgary, Edmonton, Winnipeg Among Most Popular

A downtown Vancouver sidewalk. The portion of new Canadian immigrants that settled in Vancouver declined from 13.7 percent in 2006 to 13.3 percent in 2011 as Canada’s smaller cities, particularly in the prairies, attracted newcomers with their strong labour markets (CICS News)

A Vancouver Sun report published Wednesday, titled Canada’s ‘Big Three’ metro areas lose lustre as newcomers opt for smaller cities, examines the phenomenon of immigrants choosing the Big Three Canadian cities less in favour of Canada’s smaller cities:

Released Wednesday by Statistics Canada, the 2011 numbers reveal that Toronto’s share of newcomers fell to 32.8 per cent, down from 40.4 per cent in 2006, while Vancouver’s share dropped to 13.3 per cent from 13.7 per cent. Montreal was the only “Big Three” immigration city to post a gain: 16.3 per cent of newcomers, versus 14.9 per cent in 2006.

Excluding the Big Three, the cities drawing the most newcomers were those with the most promising job markets: Calgary, at 6.1 percent of all new immigrants, Edmonton (4.3 percent), and Winnipeg (3.9 percent).

The oil wealth of Alberta has contributed to the province having the lowest unemployment rate and the highest per capita GDP in the country, making the immigration shift to that province’s cities unsurprising.

Another factor contributing to the shift to cities other than the Big Three is the Provincial Nominee Programs (PNPs), which provide those hoping to immigrate to Canada with new routes to immigrate if they are able to acquire eligible work experience in a province.

Some PNPs, like the Manitoba Provincial Nominee Program (MPNP), have a lower work experience threshold for eligibility and are granted a higher quota by the federal government for the number of foreign nationals they can nominate for permanent residence annually, and this has resulted in a boost in the number of immigrants settling in their corresponding provinces.

Canadian Jobs Move to New Industries

Employment in agriculture has declined in both the 2008-09 recession and the subsequent recovery, while employment in health care and social assistance increased through both periods

The recession has shifted the areas of employment growth in Canada according to a new StatsCan study on the country’s job market.

The analysis found that the recovery following the 2008 recession did not affect all industries similarly, with most job growth being concentrated in a relatively small percentage of the economy.

In the 9 month recession that started in October 2008, over 431,000 jobs were lost in Canada. Over the subsequent 18 months, those jobs were recovered, but not in an even matter across all affected industries.

The number of jobs in health care and social assistance for instance expanded during not only the recovery phase, but also the recession, increasing by more than 150,000 over the whole duration.

Employment in professional, scientific and technical services contracted by 3,400 during the recession, but increased by more than 100,000 during the recovery.

In contrast, some industries have lower employment now than before the start of the downturn. Employment in agriculture declined in both the recession and the recovery phase, while manufacturing and natural resources jobs did increase during the recovery, but by a smaller margin than the decline in employment during the recession.

Immigrant Income Levels Depend on Canadian Immigration Program

Data from the Statistics Canada report on the income of immigrants, released in December, shows large differences in the economic performance of immigrants depending on which immigration program they were admitted through (Moxy)

In the second part of our series on the recently released Statistics Canada report on the income of immigrants, we delve deeper into the data and look at how various economic class immigration programs compare for immigrants who arrived between 1986 and 2010. The first part can be found here.

Among the most important immigration-related issues for the federal government every year is picking the right mix of immigration programs to make up the annual quota that it sets aside for new permanent residents.

The major priorities that the federal government seeks to meet in selecting the allocation are:

  • meeting the humanitarian commitments it has set for itself to re-settle a certain portion of the world’s refugees
  • accommodating Canadians whose family members live abroad and who they would like to re-unite with through family class immigration sponsorship
  • admitting immigrants that will contribute to Canada’s economy and meet its investment and labour needs

To meet the last objective, the federal government currently allocates 60 percent of the permanent residence quota to economic class immigration programs, which consist of the Federal Skilled Worker Class (FSWC), the Canadian Experience Class (CEC), the business class programs, and the provincial nominee class programs.

Historically, the skilled worker program (FSWC) has contributed the largest portion of Canada’s economic class immigrants, but there have been calls to increase the proportion admitted through programs in the business and provincial nominee classes.

The provincial governments in particular have frequently called on the federal government to allow them to pick a greater share of Canada’s immigrants through their respective provincial nominee programs (PNPs), which has resulted in their quotas being increased from 2,500 in 1999, to over 30,000 in 2009.

Whether the FSWC should remain the mainstay of Canadian economic-class immigration or whether the PNPs, or perhaps business class programs, should continue to see their role expanded, is a question that the StatCan report can help answer.

The 30 year longitudinal study (we have only reproduced 24 years of it, as we assessed the data from 1980-1986 to be too limited to be useful) has a few surprising findings.
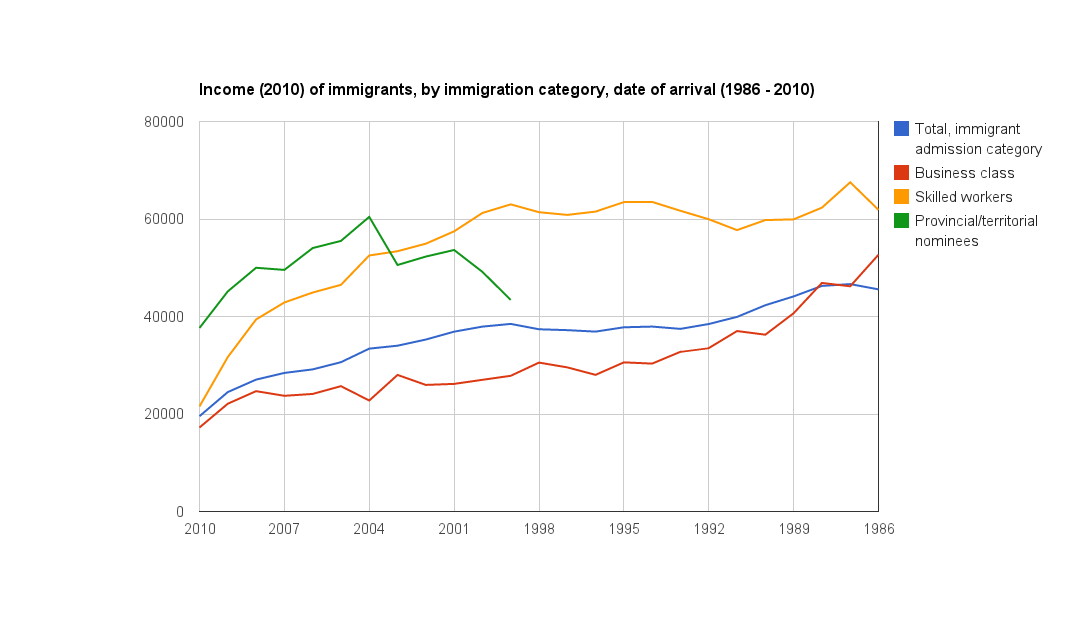
Income of immigrants by immigration program. Skilled worker class immigrants see the most wage growth over the 24 year period.

Early success for PNP immigrants, long-term success of the skilled worker class immigrants

Immigrants admitted through the FSWC earn significantly more than those admitted through the business classes, and after seven years in Canada, more than PNP class immigrants.
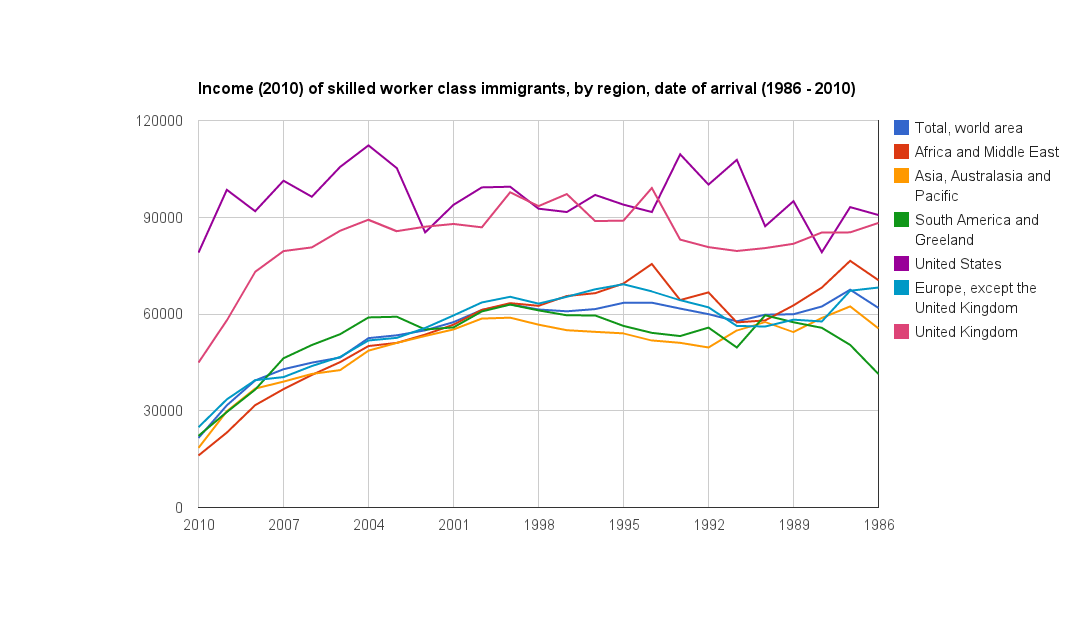
Average income in 2010 for skilled worker class immigrants. The graph shows rapid income gains in the first few years following immigration, followed by more gradual income growth

PNP-class immigrants earn nearly double what other immigrants earn in the first year of their permanent residence. This is most likely due to the fact that a person needs to already be in Canada and working to qualify for most provincial nominee programs, whereas immigrants who become permanent residents through the FSWC or business class programs arrive in Canada for the first time on the day they receive their permanent residency.

The data shows that the PNPs’ lead in income quickly closes, as FSWC immigrants see rapid income gains in their first few years in Canada.
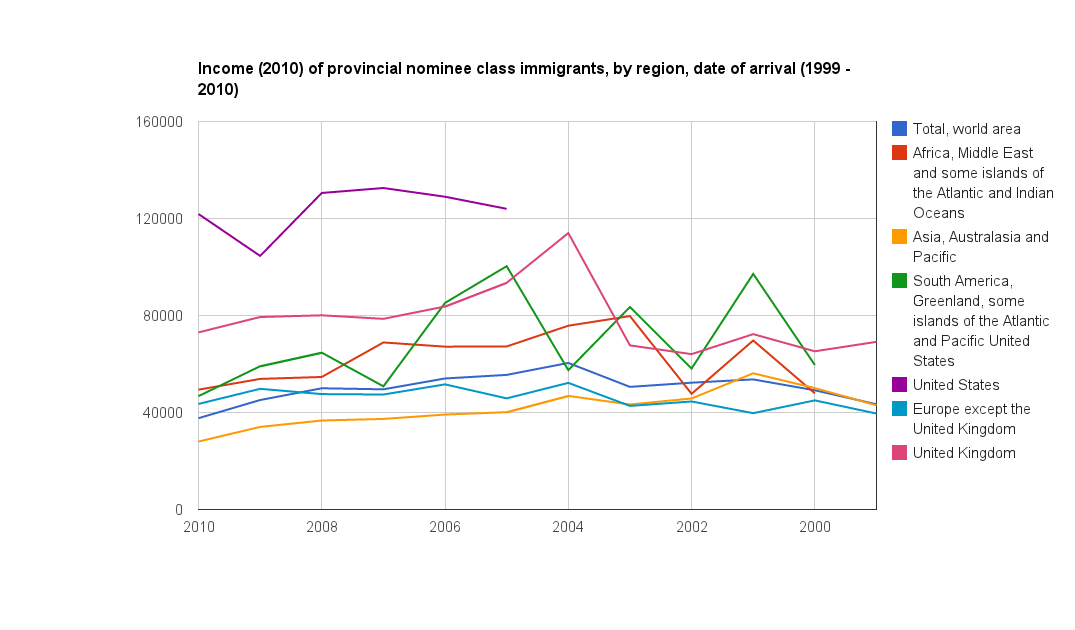
Average income in 2010 for provincial nominee (PNP) class immigrants. PNP-class immigrants start out with much higher incomes than other economic-class immigrants

It should be taken into account however that the data on PNP-class immigrants that arrived in the early 2000s is quite limited, given the provincial nominee programs admitted fewer than 10,000 immigrants for most of the first of half of the 2000s, so the long term income growth statistics for the PNP class could change over-time.

Poor performance of business class immigrants

The business class immigrants, despite having met demanding minimum net worth requirements to qualify for immigration to Canada, have lower income levels than skilled worker and provincial nominee class immigrants, especially in the first few years after they arrive.

Over the long run, their income gradually converges with the skilled worker class, but this takes nearly 24 years and it never meets the level of their skilled worker counterparts.

One partial exception to this is immigrants from the Africa and Middle East region. Business class immigrants in this group see their income surpass skilled worker class-immigrants from the same region after 24 years.
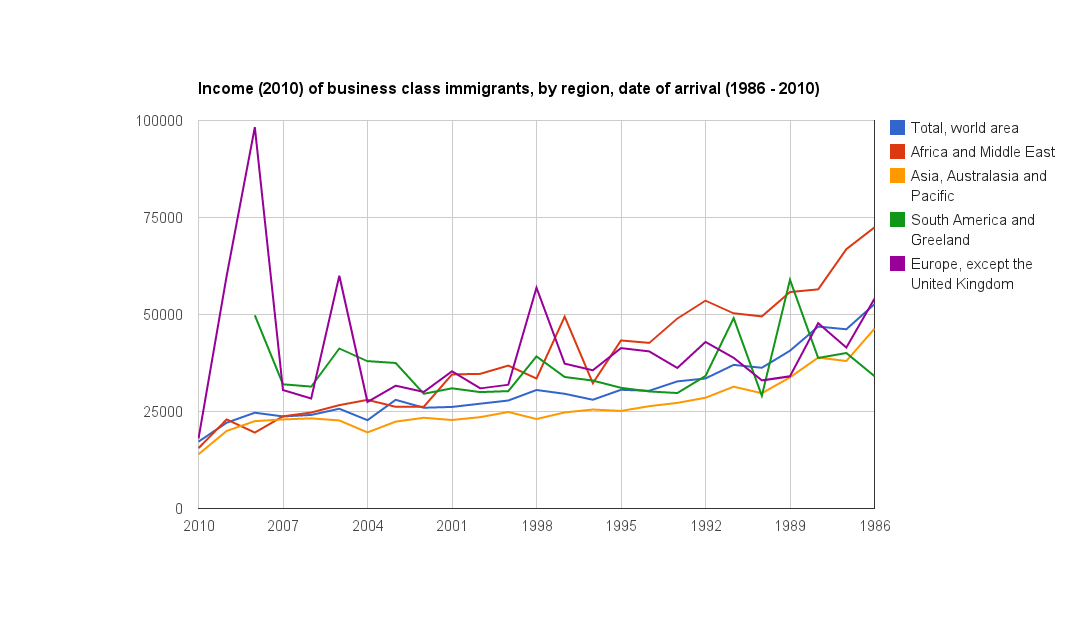
Average income in 2010 for business class immigrants. Business class immigrants from the Africa and Middle East region see significant income growth over a 24 year period

Cause of business class under-performance

Ideally, business class immigrants, with their substantial capital and business experience, would be the biggest contributors to the Canadian economy among the country’s immigrant population.

One possible explanation for their lower than expected incomes is that they keep their investments abroad.

Canada, which has relatively high average personal income tax rates, is out-matched in investment opportunities by many regions in the world, like the rapidly developing Asian country of South Korea, which has average personal income tax rates and government expenditure levels that are one third lower than Canada.

While business-class immigrants could choose to remain invested abroad, skilled worker class immigrants likely benefit from working in Canada, since it is a high-income country that provides better wages than the vast majority of the world, and in any case they have few options other than working and earning their salary in Canada, since labour is not mobile like capital.

If investment opportunities in Canada being comparatively poor is in fact the cause of lower than expected income performance of business class immigrants, this is not a problem that the federal government can fix by changing immigration selection rules.

Employment Rate of Canada’s Immigrants, Except Filipinos, Trailing National Average

A Filipino family. Filipinos have the highest employment rate of any ethnicity in Canada, and are now the largest group of new immigrants in Canada (Henry Lopez)

A Statistics Canada report released last week shows Canadian immigrants continuing to experience lower employment rates than the general population, with the gap growing since the 2008 financial crisis.

According to the report, the employment rate of immigrants aged 25 to 54 in 2011 was 75.6 percent, while that of Canadian-born residents was 82.9 percent. Both Canadian born residents and immigrants saw their employment rate fall between 2008 and 2011, by 1.8 and 1.2 percentage points, respectively.

Immigrants from the Philippines bucked the trend, with the highest employment rate of any ethnicity in Canada, at 85.6 percent.

The Philippines has also recently become the largest source of immigrants for Canada, contributing 13 percent of the new immigrant population in 2011, ahead of India (10.8 percent) and China (10.8 percent), which will likely alleviate the immigrant-Canadian-born employment gap in the coming years.

Differences across provinces

Immigrant employment rates varied across the provinces, with Quebec having the worst rates, and Alberta and Manitoba the best.

The employment gap between the Canadian born and immigrants was lowest in the Atlantic region (0.8 percentage points), but the region’s immigrant employment rate was well below the leaders, Alberta and Manitoba, where the overall employment situation is much better and immigrants are employed at rates of 82.5 and 82.3 percent.

Canada’s most populous province, Ontario, had a below-average immigrant employment rate of 75.4 percent, significantly lower than that of its Canadian born population of 83.3 percent.

The poor showing of Ontario could be partially due to the declining proportion of the province’s immigrant population who are ‘economic immigrants’, meaning those admitted through a skilled worker or investor immigration program, as opposed to family re-unification and refugee programs.

While approximately 52 percent of Ontario’s immigrants are economic immigrants, the average across Canada is 70 percent, a proportion that Ontario’s provincial government wants the province to match.

Improved employment rates over time

The data released also shows that immigrant employment rates rise the longer they have been in the country, starting at 63.5 percent among very recent immigrants (those in the country for five years or less) and increasing to 79.8 percent among immigrants that have been in the country for more than a decade.

Previous analyses done by Citizenship and Immigration Canada (CIC) have found that proficiency in French or English is among the best predictors of employment and economic success for immigrants, so these findings are not surprising.

To improve the economic performance of those admitted to Canada, CIC is increasing the language requirements for the Federal Skilled Worker Program, which is scheduled to resume in early 2013.

Canada’s Population Hits 35 Million, Immigration Largest Source of Growth

Canada’s projected population surpassed 35 million last week as the country catches up to other G8 member states in population size (Martin C. Barry)

According to Statistics Canada’s population clock, Canada’s population passed 35 million last week, a notable landmark in the country’s developmental history, from a sparsely populated British colony in the 19th century to an emerging economic force in the world today.

The data shows that the annual population growth rate in the country has averaged 1 percent over the last decade, the highest among the G8.

The leading source of population growth continues to be immigration, with net migration (immigration minus emigration) accounting for two-thirds of population increases and natural population growth the rest.

StatCan projects Canada’s population will grow to between 40.1 and 47.7 million people by 2036, with the provinces of British Columbia and Ontario experiencing the largest increase in numbers.

Newfoundland and Labrador is projected to have the lowest population growth, even possibly negative, over the same period, as immigrants choose to settle in other provinces and its own residents migrate to other regions of the country, resulting in it having the oldest population, in terms of the median age of its residents, of any province.

Rate of Self-Employment Decreases for Sons of Immigrants, Increases for Daughters -Study

Self-employment rates of Canadian-born sons of immigrant parents are lower than that of their fathers, while those of Canadian-born daughters of immigrants are higher than that of their mothers' generation. (Eric Ward)

A study on intergenerational changes in self-employment rates among immigrant parents and their children finds that the Canadian-born sons of immigrant parents are less likely to be self-employed than their fathers, and are likely to choose self-employment for different reasons, while the Canadian-born daughters of immigrant parents are more likely to be self-employed than their mothers.

According to the Statistics Canada study, 12 percent of Canadian-born sons of immigrant parents aged 25 to 44 were self-employed in 2006, while 14 percent of immigrant fathers were self-employed at the same age in 1981. For Canadian-born daughters of immigrant parents, the self-employment rate increased to 7 percent, from 6 percent for their immigrant mothers in 1981.

The factors “pushing” individuals into self-employment differed between second generation and first generation men as well.

Among immigrant fathers in 1981, the main motivation for choosing self-employment was lack of employment opportunities, while among their Canadian born sons in 2006, there was a higher likelihood that expectations of greater earnings motivated them to choose self-employment.

The study finds that the generational decline in self-employment rates among the Canadian-born sons of immigrant parents is due to a larger trend in the typical life course events of Canadian men. Canadian men aged 25 to 44 have less work experience, are less likely to be married and have fewer children than their fathers when they were at their age.

Canada’s Real Wage Growth Stagnant For Last 30 Years -Report

Average hourly wages increased by only three dollars from 1981 to 2011 after adjusting for inflation

A report published last month as part of Statistics Canada’s Economic Insights series finds that average real wage rates increased by only 14 percent in Canada from 1981 to 2011.

According to the report, real hourly wages, meaning hourly wages after adjusting for inflation, increased from approximately $20.70 in 1981, to $23.70 in 2011, a $3 wage gain in 30 years. Median real hourly wage growth was even more meager, increasing by approximately $2, to $20.90, between 1981 and 2011 -a 10.6 percent increase over three decades.

Different rates of wage growth were observed in the earlier and latter halves of the last 30 years, with average real hourly wages rising by only 4 percent in the 17 year period from 1981 to 1998.

After deep spending cuts by the federal government in the mid-1990s, which brought total government spending levels down from 53 percent of GDP in 1992, to 43 percent of GDP in 1998, the rate accelerated, with wages increasing 10 percent in the 13 year period from 1998 to 2011.

Much of the developed world has experienced wage stagnation over the last four decades. Explanations for the slow down include:

  • the break-down of the Bretton-Woods system, which pegged the world’s currencies to gold, in 1971, and the subsequent increase in monetary inflation, resulting in nominal wage hikes not keeping up with inflation
  • globalization and corporate outsourcing to low wage countries
  • an ‘innovation saturation’ as economies mature
  • the entrance of women into the work force increasing the supply of labour
  • an increase in government spending levels diverting economic output from private sector investments

Nominal wages in Canada increased by 1.1 percent in 2011, substantially less than last year’s annual inflation rate of 3.2 percent.